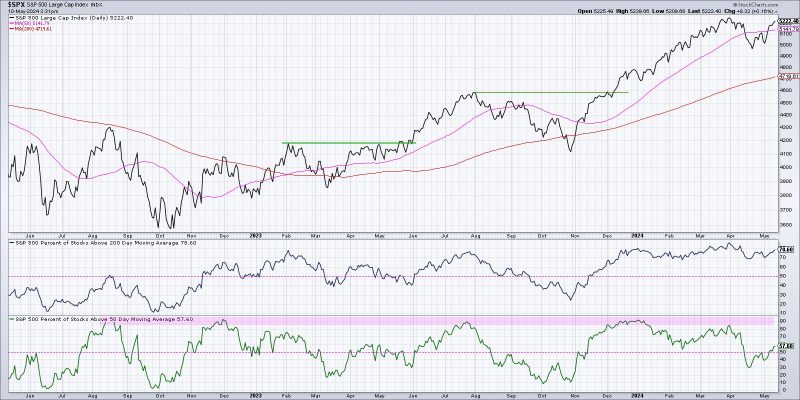
1. Advance/Decline Line (AD Line)
The Advance/Decline Line, often abbreviated as the AD Line, is one of the most widely used breadth indicators for identifying a bullish market trend. This indicator offers potent insight into market behavior by measuring the number of stocks advancing against the number of stocks declining over a particular period.
The calculation of the AD Line is relatively straightforward; subtract the number of declining stocks from the number of advancing stocks, and then add the result to the previous value of the AD Line. The progressive cumulative total depicts market momentum- when increasing, it shows a bullish trend, suggesting that a majority of stocks are participating in the upswing.
In essence, if the AD Line is rising and reaching new highs alongside the market index, it confirms a bullish market trend, showing that the uptrend is broad-based and robust. On the other hand, if the market index is reaching new highs while the AD Line fails to reach new highs, it may indicate a market top happening soon.
2. On Balance Volume (OBV)
On Balance Volume (OBV) is a momentum indicator that uses volume flow to predict changes in stock prices. Developed by Joe Granville in 1963, OBV reflects the relationship between price changes and trading volume. The indicator tends to preclude price since it adds volume on up days and subtracts volume on down days.
The principle behind OBV is that changes in volume often precede price changes. When On Balance Volume increases or decreases in tandem with price, it confirms the ongoing price trend. Specifically, in a bullish market, if prices increase with vibrant volume, OBV will rise, providing a confirmation of the bullish trend.
However, if volume isn’t complementing the upward price movement (i.e., OBV doesn’t increase while price ascends), it’s a sign of a weak bullish trend and might imply that a trend reversal is lurking.
3. McClellan Oscillator
The McClellan Oscillator is a market breadth indicator developed by Sherman and Marian McClellan. This tool, based on the Exponential Moving Average (EMA), measures market momentum.
The Oscillator is a differential between 19-day and 39-day EMAs of NYSE advances minus declines. A positive McClellan Oscillator represents a bullish market trend as more stocks are gaining (advancing) than falling (declining).
During bullish phases, the McClellan Oscillator stays largely positive. When it dips below zero and then moves back above, it’s viewed as a bullish signal. Conversely, when the Oscillator is positive but starts to decline, it’s a hint that the market breadth is tapering off, and the bullish phase might be nearing its end.
The McClellan Oscillator, therefore, helps traders identify overbought and oversold conditions. During extreme bullish conditions, when the market may seem overbought, the Oscillator may fall, suggesting a correction or reversal soon.
By monitoring these three breadth indicators – the Advance/Decline Line, On Balance Volume, and the McClellan Oscillator – investors and traders can acquire a more holistic understanding of market behavior. Used together, these tools can more reliably confirm the strength of a bullish trend, enabling more strategic and informed market decisions.


