
Understanding Head and Shoulders Top Pattern in the Semiconductor Industry
The head and shoulders top pattern is a significant chart formation that is widely used in technical analysis. Developed with distinct components including the left shoulder, head, right shoulder, and neckline, the pattern is an indication of the potential reversal of an uptrend, particularly significant in the semiconductor industry.
Body of the Head and Shoulders Pattern
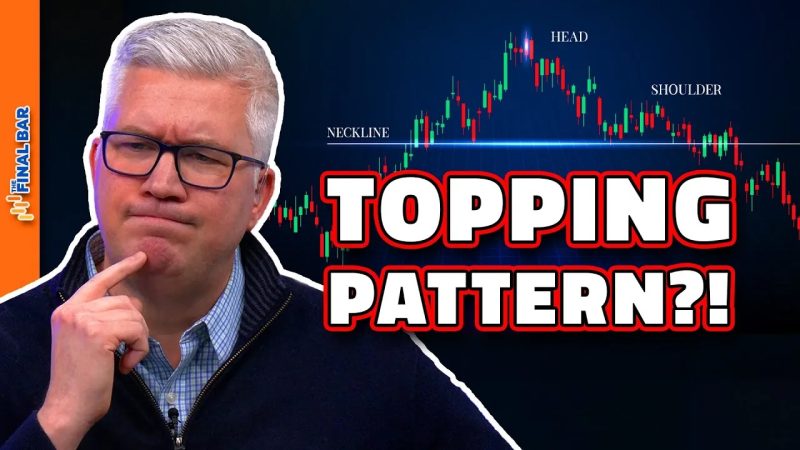
The head and shoulders pattern is named due to its resemblance to a human head, between two shoulders. Initiated by an increase in prices referred to as the left shoulder, it is followed by a peak, that forms the head. Then, a decline occurs which forms the neckline of the pattern. Finally, there’s a rise and subsequent fall, culminating in the right shoulder.
The level of the left shoulder is usually similar to the right shoulder and the head is usually the highest point. The pattern is deemed complete when the price falls below the neckline thus indicating a trend reversal from a bullish trend to a bearish one.
Relevance of the Pattern in the Semiconductor Industry
In a highly volatile industry like semiconductors, the head and shoulders top pattern plays a pivotal role in enabling traders to understand market trends. Semiconductors, the backbone of growing technological innovations and digital transformation, are extremely sensitive to global economic trends. By recognizing these patterns, investors and analysts can make informed decisions.
Factually, the head and shoulders pattern is often seen in semiconductor stocks because these stocks are more likely to exhibit high volume and volatility given their sensitivity to economic cycles, technological advancements, and financial news. Thus, the pattern holds great significance for those invested in this industry.
Practical Applications in Semiconductors
A practical instance of this pattern could be seen in the way semiconductor stocks behave. Suppose, the price of a certain semiconductor stock rises, marking the creation of the left shoulder, then it sharply increases to form the head, followed by a plunge. After bouncing back slightly, forming the right shoulder, if the price continues to fall below the initial trend line or neckline, it indicates a sell signal for the market participants.
Investors can use this pattern to set stop-loss points for their investments. If the trend line is broken, investors may consider reducing their positions or exiting them entirely as it signals a downward trend. Hence, the head and shoulders top pattern can serve as a protective measure for investors in the semiconductor industry.
The Limitations
While the head and shoulders top pattern can serve as a useful tool, it does not guarantee success. Technical analysis is only one aspect of investing. Fundamental analysis, including evaluating a company’s financial health, product portfolio, market competition, and the overall health of the economy, should also play an integral part in investment decisions.
In conclusion, the head and shoulders top pattern serves as a valuable tool for investors to predict potential trend reversals, especially in the semiconductor industry. However, it’s also crucial for investors to consider other analytical tools and factors to make well-rounded investment decisions.


