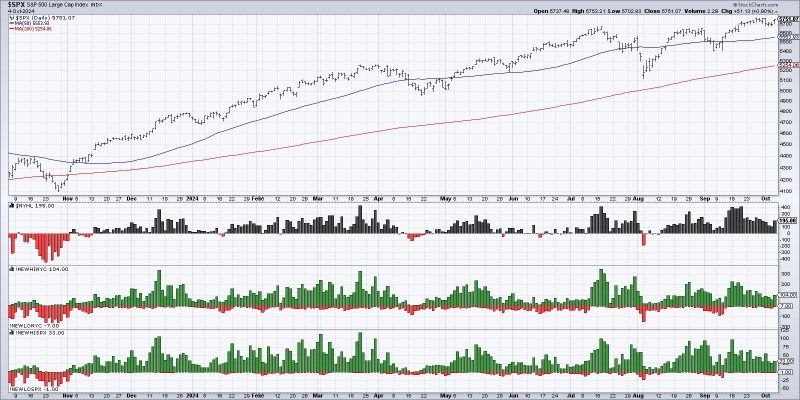
Breadth in the financial context, pertains to a metric used in stock market analysis that represents the overall participation of all stocks in market movements. When assessing market breadth, market strategists examine the number of stocks advancing versus the number of stocks declining. A healthy market is generally characterized by strong breadth, wherein a large percentage of stocks participate in a market upswing. Alternatively, weak or ‘bad’ market breadth can be indicative of an unstable or weakening market.
‘Bad’ market breadth is usually typified by a disparity, where a small number of large-capitalization stocks drive the entire market’s gains, but the bulk of smaller stocks are stagnating or even declining. This phenomenon is like a visibly healthy tree but with roots beginning to rot. On the surface, everything may appear to be fine and dandy given the apparent strength of large-cap stocks such as those in the S&P 500 or Dow Jones Industrial Average. However, the underlying weakness of the majority of stocks signifies that all might not be well below the surface.
One of the primary reasons that the market can possess bad breadth lies in investor sentiment. During times of financial uncertainty or looming economic recession, investors typically migrate to large, established companies which are perceived as safer investment havens. This migration can prop up the overall market index while obscuring stagnation or drops in the majority of stocks.
Another reason may be sector-specific rallying. If one particular business sector with substantial market-cap is thriving while others are struggling or simply maintaining their positions, said sector can lift the overall market, creating an appearance of health despite lackluster breadth.
Bad breadth is not beneficial for the market in the long run as it indicates a lack of broad participation and divided performance. This kind of disparate performance can be a red flag, signifying an impoverished market foundation that is susceptible to significant downturns. Major market crashes in history were often preceded by periods of bad breadth, marked by a growing divide between advancing and declining stocks.
Nevertheless, bad breadth by itself doesn’t always predict a market downturn. Broader economic factors, investor sentiment, political stability, global trade and liquidity conditions, etc., all contribute toward market movements. Moreover, during the early stages of economic recovery, bad breadth might be visible, and as the recovery becomes more widespread and reaches the smaller-capitalization stocks, the breadth eventually improves.
There are several ways to measure market breadth. Tools such as the Advance/Decline Line (A/D Line), the McClellan Oscillator, Bullish Percent Index, and High-Low Index offer insight into the current state of market breadth. Investors need to consistently monitor these signals and not just the overall market index to make informed decisions.
In a nutshell, bad breadth in a market underscores a need for a more in-depth analysis of investor sentiment and market dynamics beyond surface observations of the major indices. Understanding whether the market has bad breadth and interpreting its implications is a key component of comprehensive market analysis and strategic investment planning.


