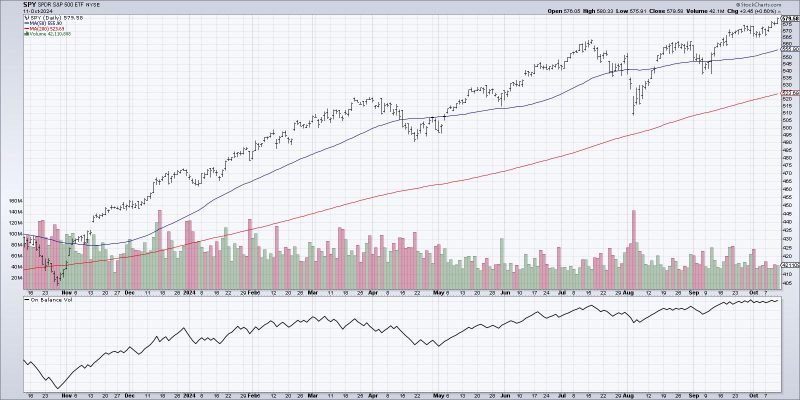
The financial market is a complex system with numerous indicators that many investors and traders watch to make enlightened decisions. Out of these several indicators, one that stands out and has proven to be a reliable guide is known as the Volume Indicator. A fundamental aspect of technical analysis, the Volume Indicator is instrumental in providing insights about the force behind a price movement.
Understanding the Volume Indicator
The Volume Indicator, playing a pivotal role in technical analysis, is a tool that provides data about the amount of securities being traded over a specific period. It is an uncomplicated measure of market activity that underlines periods with unusual buying or selling behavior. This statistical measure is vital among institutional traders and analysts, giving an essential glimpse of market trends and investors’ interest in a particular security.
Role of the Volume Indicator
A common misconception is that the price of securities solely reflects market sentiment. However, the reality is that price is only one half of the story. To get a full picture, investors need to understand the role of volume. The Volume Indicator acts like a lie detector test in an interrogation. It reveals the truth behind a price movement. If prices are moving in an upward or downward direction, the volume can validate its strength.
Normally, a rise in trade volumes accompanies a price spike. This indicates strong buyer commitment and helps confirm the legitimacy of the price movement. A high-volume surge can also witness a potential end to a trend, signaling the market’s anticipation to change course.
Advantages of the Volume Indicator
The Volume Indicator helps predict upcoming price changes, especially when combined with price data. By reviewing volume levels, traders can identify potential reversal points. When price reaches a new high or low, but volume doesn’t follow, it’s often a signal that the trend is weakening. This discrepancy between price and volume is called divergence and can be a powerful signal in predicting trend reversals.
Also, volume can hint at the liquidity level of a security. This is crucial, especially for institutional investors who deal with large quantities of shares; they require a high liquidity level to ensure a smooth transaction without affecting the price drastically.
Different Types of Volume Indicators
Many different types of volume indicators can be used in trading. The most popular types include the On-Balance Volume (OBV), the Chaikin Money Flow, and the Volume-weighted Moving Average (VWMA). Each one utilizes volume data differently, delivering unique insights.
The OBV, for instance, adds a period’s volume when the close is up, and subtracts it when the close is down. This gives a cumulative total and shows if the volume is flowing into or out of a security. The Chaikin Money Flow, on the other hand, calculates the amount of Money Flow Volume over a particular period. It essentially bulletins whether the money flow volume is fair, overbought, or oversold over the given time. The VWMA prioritizes days with higher volume. It is best suited for identifying the shorter-term trend in a long-term trend.
Application of the Volume Indicator
Applying the Volume Indicator is a simple practice. It can be incorporated into any investing strategy. Most trading platforms offer the option to overlay volume data directly onto the price chart. This allows for easy comparison between volume levels and price action. Other investors may prefer to keep volume as a separate bar chart underneath their price chart to identify volume spikes easily.
In conclusion, the Volume Indicator is an under-utilized tool that can arm investors and traders with the knowledge they need to make informed decisions. It offers a significant edge in the market and, when used rightly, can open up numerous profitable opportunities. It’s like the wind behind the sail; it provides the necessary momentum for the ship to navigate the sea.


