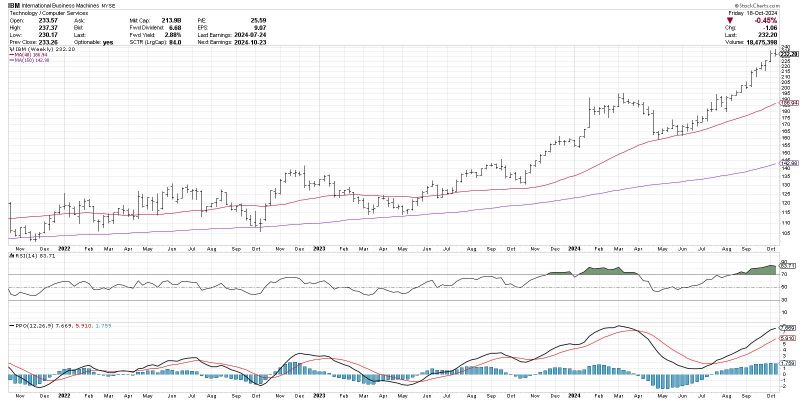
Understanding the Moving Average Convergence Divergence (MACD) histogram is vital for many traders looking to anticipate trend changes in various assets. Regarded as an essential technical indicator, the MACD histogram offers a visual representation of the difference between the MACD line and the signal line.
At its core, the MACD histogram is fundamentally advantageous in assessing the momentum of assets. This momentum is essentially the speed at which the price of an asset changes. Generally, most momentum oscillators focus on key parameters like volume and price to provide traders with a sense of the market’s direction.
The principle behind this technical tool is straightforward: when the MACD line crosses above the signal line, the histogram bar is positive, and most traders consider it a bullish signal. On the contrary, when the MACD line crosses below the signal line, the histogram records a negative value, which is a bearish signal.
Some traders attest that the MACD histogram tends to anticipate key market movements more accurately than the MACD lines. This assertion is based on the premise that the histogram represents the difference between the two lines. Therefore, as the histogram moves towards the zero line — which indicates a convergence between the MACD and the signal lines — traders start to anticipate a potential shift in market trends. Convergence and divergence of the MACD line are viable signals of a numerator and denominator closing in together and moving away, respectively.
Moreover, traders attach significance to the histogram’s zero line. When the bars move from negative to positive territory, it signifies a bullish trend. In contrast, a shift from positive to negative territory portends a bearish trend. Traders can therefore anticipate a bullish or bearish trend when the histogram crosses the zero line.
Another considerable advantage of the MACD histogram is its capabilities that extend beyond spotting potential crossovers. The histogram is also an indicator of potential for divergences, which are known to precede reversals in the market. Therefore, traders can use these divergences identified by the MACD histogram to predict an upcoming reversal, allowing them more time to plan their strategy amidst changing market trends.
Drawing attention to the potential pitfalls of the MACD histogram, one must consider its tendency to be a lagging indicator. Although it identifies reversals and crossovers, its accuracy depends on market conditions. In a trending market, the MACD histogram may produce false signals, which can lead to poor trading decisions.
Furthermore, solely relying on the MACD histogram without considering other technical and fundamental analysis could lead to biased trade decisions. Integrating the histogram with other trading strategies and indicators can offer more precise and balanced market insights.
In conclusion, the MACD histogram is a powerful technical analysis tool that can provide traders significant insights into market trends. Its ability to anticipate trend changes could potentially help traders stay one step ahead in their trading endeavors. However, its effectiveness depends on the trader’s ability to interpret the signals correctly and incorporate them with other trading strategies. Therefore, while the MACD Histogram might hold the secret to anticipating trend changes, it should be used cautiously and wisely to maximize its advantages.


