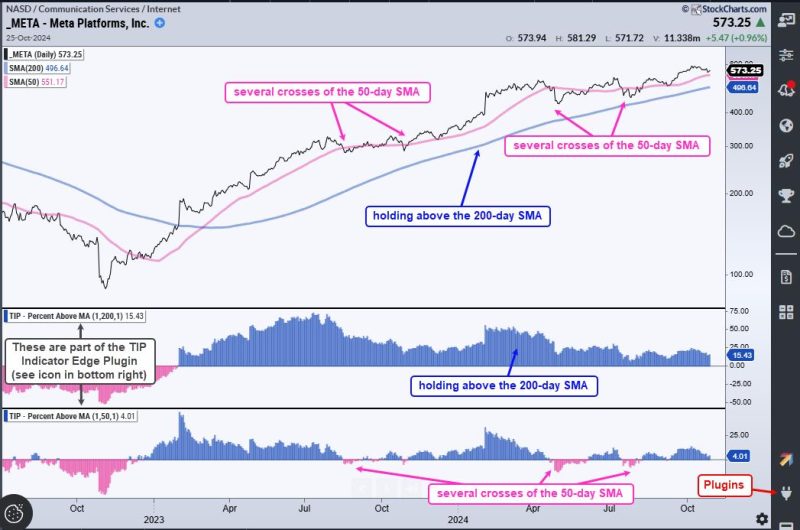
Understanding market dynamics and making informed trading decisions requires keen knowledge and utilization of various tools and indicators designed to synthesize raw market data into concise, vital information for traders. Among these tools and indicators that can drastically improve your trading edge are Volume Weighted Average Price (VWAP) and Relative Strength Index (RSI). These indicators, when understood and employed correctly, can lead to more successful and profitable trading strategies.
Volume Weighted Average Price (VWAP) is one such key indicator. The VWAP is a trading benchmark used by traders that gives the average price a security has traded at throughout the day, based on both volume and price. It is crucial because it gives traders insight into both the trend and value of a security.
One fundamental aspect of VWAP is its role in determining market trends. By comparing the current market price to the VWAP values, traders can objectively identify a bullish or bearish market. If the current market price is higher than VWAP values, the market trend is bullish. Conversely, if the current market price is lower, the trend is bearish. This critical revelation can guide traders in their buying or selling decisions to improve their market edge.
Additionally, VWAP can provide valuable insight into the fair value of a security. If a security’s price is significantly above the VWAP, it could be seen as overvalued, and therefore, this could be a signal to sell. Conversely, a security price significantly below VWAP could be seen as undervalued and thus, a potential buying opportunity.
Another invaluable indicator that can help to improve a trader’s edge is the Relative Strength Index (RSI). Essentially, RSI measures the speed and change of price movements to identify overbought or oversold conditions in the market. It is depicted in a range of 0 to 100, with levels above 70 indicating overbought conditions and levels below 30 indicating oversold conditions.
The advantage of using RSI as an indicator lies in its ability to highlight potential reversal points in the market. If the RSI reveals that a security is overbought, this could suggest that the security is due for a price correction or pullback. Likewise, an oversold signal could suggest that the security is due for a price bounce. This enables traders to anticipate potential price reversals and time their entries and exits more effectively.
Furthermore, RSI can also be applied to spot trend formations early on. By drawing a trend line that connects the higher lows in an uptrend or lower highs in a downtrend, RSI can be utilized to identify potential breakouts or breakdowns. When the RSI breaks the trend line, it could signal a change in trend, providing traders with potential trading opportunities.
Both VWAP and RSI, therefore, provide instrumental market insights for traders. While the VWAP enables traders to identify market trends and assess the fair value of a security, the RSI allows traders to identify potential price reversals, spot trend formations, and improve their market timing. These two indicators, when used together, can significantly enhance a trader’s edge and lead to more profitable trading strategies.


