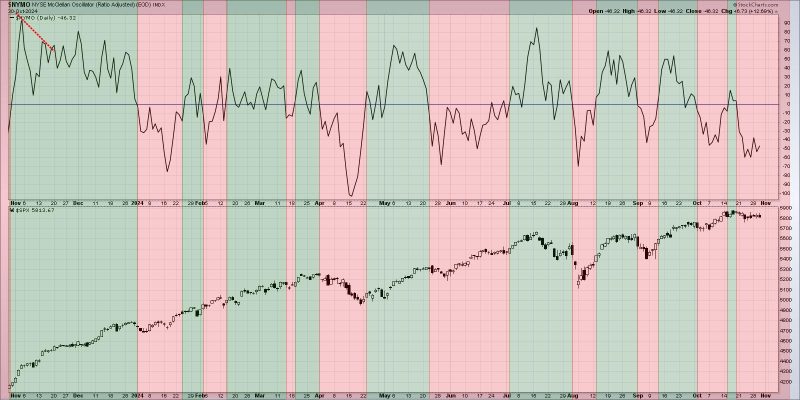
Recognizing Market Movements: Will Breadth Divergences Signal the End of the Bull?
The financial market is a dynamic entity that can shift at the drop of a pin. Investors and traders continuously monitor these changes to make strategic decisions. One of these indicators is breadth divergence. This concept is vital in technical analysis as it enables investors to predict potential changes in market trends. The end of a bull market may be heralded by numerous factors, one of them being breadth divergences.
Understanding Breadth Divergences
Breadth divergence is a phenomenon that occurs when the price action of an index diverges from the cumulative total of its components. For instance, if the overall index is moving up while a significant number of constituent stocks are falling, it heralds a negative or bearish breadth divergence. Conversely, a bullish divergence occurs when the index is declining while most of its components are rising. These divergences are critical indicators of underlying weaknesses or strengths in the market.
Breadth Divergence and Bull Markets
While the stock market continues to soar, many believe the bull market is near exhaustion. The primary justification for this assumption is the presence of a bearish breadth divergence. The index may be reaching new highs, but upon closer examination, one can notice a vast number of stocks are underperforming. This discrepancy creates a divergence that, in this case, is bearish and is often a revelation of a potential trend reversal.
Decreasing market breadth or divergences don’t immediately signal the end of a bull market, but they are cautionary indications that momentum is faltering. Breadth divergences may be an advanced warning of a looming market top as the divergence often occurs months before the actual market top.
How Breadth Divergences Predict the Market End
Breadth divergences impact market sentiment. When fewer stocks contribute to market advances, it suggests a lack of widespread confidence in the market’s overall health. A narrowing of breadth usually precedes a significant downturn as it indicates a decreased number of stocks are driving the market upward. It suggests that the market is becoming vulnerable and any sharp fall in these leading stocks can lead to a broader market decline.
Additionally, during bull markets, there is usually a broad spectrum of stocks that benefit from the upward momentum. However, when the number of outperforming stocks decreases, and only a select few drive the rally, it’s usually a bearish breadth divergence.
Defensive Measures
Witnessing such divergences should alert investors to take defensive measures, thereby protecting their investments against an imperiled market posture. It does not mean immediate liquidation of ownership, but rather a more cautious and balanced investment strategy. This strategy could include diversifying one’s portfolio, setting up stop-loss orders, or shifting towards more stable assets.
In conclusion, while breadth divergences are not accurate prediction tools for the end of a bull run, they do provide investors with a heads up on potential changes in the market trend. They hint at a diminishing momentum that may precede a market downturn, thereby allowing strategic adjustments.
Investors should, therefore, keenly observe market breadth and adjust their strategies accordingly when divergences are detected. Using market breadth data alongside other indicators will act as a security measure enabling investors to make more informed decisions that could potentially save or earn them significant capital.


