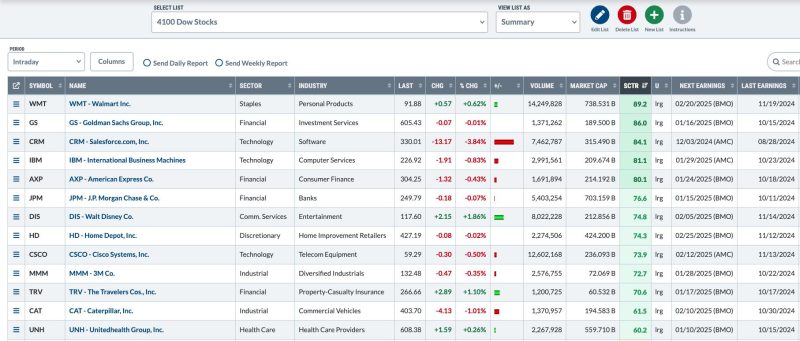
1. Create and Track Personal Indexes
The use of ChartLists isn’t limited to tracking stocks, ETFs, or mutual funds. You can create a personal index that reflects your investment style. For instance, if you’re a tech-oriented investor, you can create a personal index comprised of your favorite tech stocks, and monitor the overall portfolio performance through ChartLists. This is not tedious to implement; a simple daily update of the percentage changes of your stocks will provide a clear trend of your portfolio. In the long term, tracking your indexes will help you review your strategy and make necessary adjustments.
2. Assess Sector Rotation
Sector rotation is an investment strategy involving the movement of financial resources from one sector of the industry to another. Through ChartLists, you can create lists of companies operating in the same industry sector to identify potential investment opportunities. For instance, you can have a list of stocks for pharmaceutical companies, technology companies, and so on. Monitoring the trend of these lists can help identify when a certain sector is outperforming the others, thus indicating a good time to invest.
3. Simplify Scanning and Sorting
Whereas scanning helps identify stocks that fit certain technical criteria, sorting involves lining up these stocks from the best to worst performers based on some specified keys. However, the process can be exhausting, especially with numerous stocks to scan and sort. ChartLists simplifies these processes. With sector or index lists, for instance, you can easily scan for certain patterns or sort the results based on the price, percent change, or volume.
4. Monitor Intermarket Relationships
Intermarket Analysis involves comparing different sectors or security types to gauge the overall health of the financial market. Since different market sectors tend to lead or lag others, investors can identify opportunity areas by monitoring these relationships. With ChartLists, you can monitor stock-bond, stock-commodity, or even international relationships. You can also track intermarket performances to identify correlations and divergences over time and thus make more informed investment decisions.
5. Review Fundamental Analysis
Fundamental analysis involves interpreting financial statements to evaluate an investment’s intrinsic value. Among the key aspects to consider include earnings per share (EPS), profit margins, return on equity, and others. However, since fundamental data is typically presented in tables, it can be difficult to identify significant trends or changes. To simplify this process, you can use ChartLists to graph the data, track the year-to-year changes, and quickly identify significant changes. This can greatly enhance your fundamental analysis and hence the investment decisions.
In summary, ChartLists is a powerful tool for any investor who wants to stay ahead of the market’s curve. It simplifies many investing activities and provides a deeper insight into market performance, thus increasing the chances of successful investing. Use ChartLists to track personal indexes, assess sector rotation, simplify scanning and sorting tasks, monitor intermarket relationships, and enhance your fundamental analysis.


