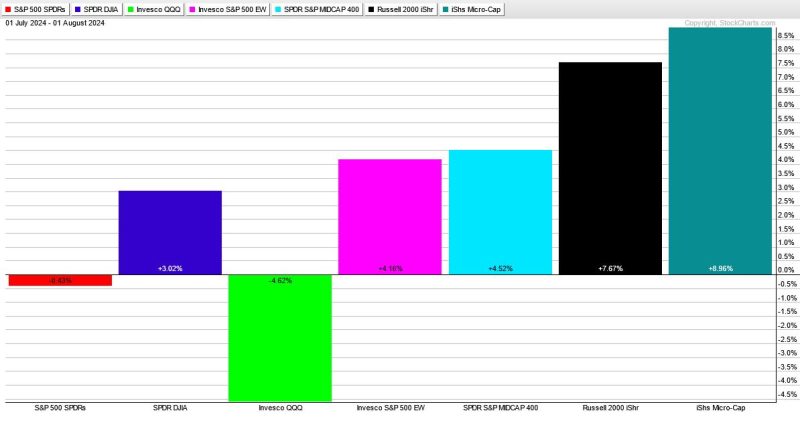
The instability that stocks have recently experienced is reflected in the movements of several key breadth indicators. When examining these various benchmark indicators, it’s clear that a particular breadth indicator, the percentage of stocks above their 50-day moving averages, points towards a potential downside. Nonetheless, where some see a fall, others perceive a buying opportunity.
The principle focus of this article would be on that specific breadth indicator: the percentage of stocks trading above their 50-day moving averages (DMA). Numerically speaking, a high percentage suggests bullish sentiment, as it indicates that most stocks are on an upward trend. Conversely, a low percentage signifies bearish sentiment, implying that the majority of stocks are declining. This key stock market indicator, therefore, is instrumental in determining the overall market trend and can predict potential reversals.
Recently, the percentage of stocks trading above their 50-day moving averages has seen a significant decline. In broad terms, this suggests more than just a period of consolidation or adjustment. It hints at a market becoming increasingly bearish.
While such a trend could be unsettling for many investors, it’s crucial to elucidate that a declining percentage doesn’t necessarily indicate a dramatic crash. Indeed, the market could continue its descent for a while before finding support. As unsettling as this downside seems, it also opens up interesting buying opportunities.
Experienced investors understand that the stock market operates cyclically. Stock prices rise and fall over time, and this natural ebb and flow can be amplified by a variety of factors such as shifts in economic indicators, investor sentiment, geopolitical events, and more. Therefore, a bearish trend, which is currently implied by the falling percentage of stocks above their 50-DMA, is not always synonymous with disaster. Instead, it can be an entry point for investors looking to capitalize on lowered prices.
To navigate these potentially challenging waters successfully, investors should take a step-by-step approach. Identifying good value stocks that have fallen during this downswing is the first, crucial step. The second step is the proper timing of the entry point, which should ideally be around the time when the percentage of stocks above their 50-DMA starts rebounding, indicating a switch from a bearish to a bullish market.
It’s important to underscore that the task isn’t without risk. A market downturn can extend for an unpredictable length, and stocks could potentially further deflate before rebounding. Investors should therefore merge careful analysis with prudent patience, and allocate resources accordingly.
In conclusion, the current market scenario, as pointed out by the downward trend of the percentage of stocks above their 50-day moving averages, might seem foreboding. Yet, for the astute investor willing to decipher market breadth indicators, this could very well morph into a chance to purchase stocks at a discounted rate, hence bridging the gap between risk and opportunity.


