
As we look to the trading week that lies ahead, it seems that there is a chance that the NIFTY, India’s broad-based stock market index, will remain more or less within a certain range in the imminent term. However, there could be some trending moves seen if certain defined edges are breached.
The National Stock Exchange (NSE) index, NIFTY, is built on the stock performances of 50 significant companies across 13 sectors of the Indian economy. In this intricate ecosystem, the ebb and flow of the index create defined boundaries, which, if breached, can trigger a trending move across the board.
The first edge of consideration is the lower support level, which falls at 17500. If prices were to drop below this point, we may witness a bearish trajectory for the benchmark index. To put simply, this lower edge describes a point where investors begin to buy up stocks, assuming that they will not fall any further. A breach of this boundary could indicate that pessimism is invading the market, which in turn could trigger a downward trend.
A dramatic shift in the price, however, can also happen at the upper edge, which is usually considered as a resistance level. Currently, the NIFTY’s upper edge resistance level is at 18000. Seeing prices suddenly break past this level could signal the onset of a bullish trend. Factors such as an influx of foreign direct investments, visible growth in the Gross Domestic Product, or significant changes on the policy front can contribute to such a possible change.
In the simplistic terms, a breach at the upper edge infers that the investors are optimistic about the future, developing a buying spree which could send the market shooting upwards. Seeing NIFTY above 18000 would trigger a buy signal for a wide variety of institutional investors, fund managers, and retail investors.
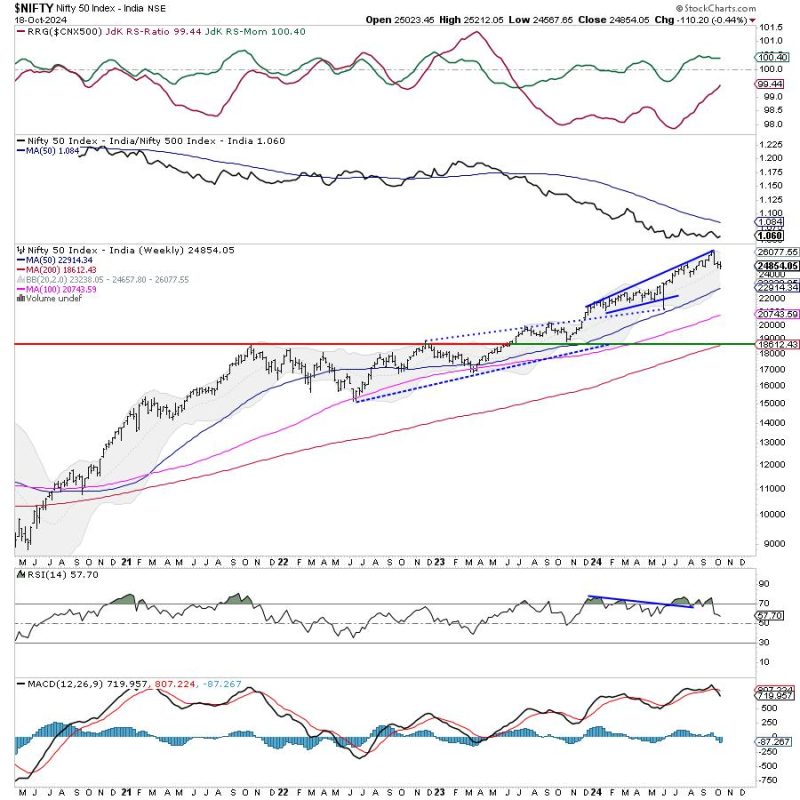
The various moving averages also play a vital role in determining the trend. If the NIFTY is trading above its key moving averages, it signifies a bullish trend but if it is trading below, it implies a bearish trend. For instance, the 50-day moving average (DMA) is a particularly significant line in the sand, acting as a key area of institutional buying interest.
Furthermore, it is important to keep an eye on the Relative Strength Index (RSI) and Moving Average Convergence Divergence (MACD) signals. These are momentum indicators that can provide insights into potential market reversals or confirmations of the existing trend.
If the RSI and MACD lines cross their respective threshold levels, it would indicate a shift in momentum, signalling a possible trend reversal. And if their lines move in sync with the price, it confirms the current trend, be it bullish or bearish.
While keeping abreast with such market indicators, it is also suggested to track global macroeconomic factors like changes in crude oil prices, currency fluctuation, geopolitical tensions, or announcements by international central banks, as these often have a spillover effect on the Indian stock market.
In conclusion, it seems probable that NIFTY may stay ranged. However, if the edges of 17500 and 18000 are breached, it could trigger trending movements in either direction. Traders and investors should thus closely monitor these edges and other market indicators, and align their trading strategies accordingly, to seize potential opportunities in the upcoming week.


