
The beginning of a potential distribution phase is a crucial period in any market, be it stocks, cryptocurrencies, or other. This phase often signifies a change in market trend where the strength of buyers begins to diminish and that of sellers starts increasing. Therefore, understanding the onset of this phase can be highly beneficial for institutional and retail investors alike. Here, we discuss three effective ways to visualize potential distribution phases.
The first technique is the Price Volume Trend indicator or PVT. This highly effective tool helps visualize the start of the potential distribution phase by combining price and volume to track the flow of funds into or out of the market. The PVT increases when the volume and closing prices are high, indicating strong buying interest. On the contrary, a decrease in PVT is a sign that selling pressure is building, marking the beginning of a potential distribution phase. On a graph, you can clearly see the PVT’s descending line, which sheds light on the increasing dominance of sellers.
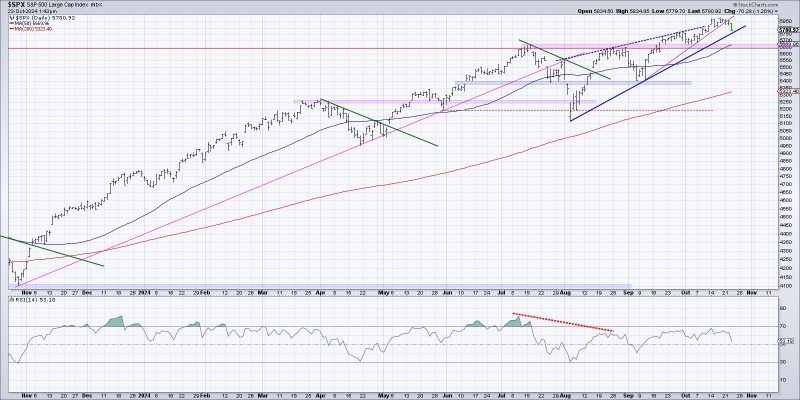
Secondly, we talk about the “Relative Strength Index” or RSI. This indicator is an excellent tool for spotting potential reversals in the market trend, including the start of distribution phases. RSI compares the magnitude of recent gains to recent losses, which helps traders identify when a financial instrument is overbought or oversold. In the context of a distribution phase, when an asset’s RSI starts dropping below the 70 level, it often signifies that the asset is exiting its overbought condition. On a chart, this shift can be visualized as the RSI line moving downwards crossing the 70 levels mark, indicating the increasing influence of sellers, a characteristic feature of the distribution phase.
For the third technique, we introduce the “On-Balance Volume” or OBV. This is a momentum indicator that uses volume flow to predict changes in stock price. The OBV anticipates a potential distribution phase by measuring cumulative buying and selling pressure, adding volume on up days and subtracting volume on down days. It assumes that when volume increases sharply without a significant change in the stock’s price, the price will eventually jump upward, and vice versa. In other words, OBV will start decreasing when there is more selling than buying, which often marks the beginning of a potential distribution phase. This can be visualized on the OBV chart as the fall of the OBV line.
These three methods, namely the PVT, RSI, and OBV, are powerful tools for visualizing the start of a potential distribution phase. They allow traders and investors to read the market trend accurately and make informed decisions based on the balance between buyers and sellers. By effectively implementing these indicators in your analysis, you can potentially enhance your market prediction capabilities thereby optimizing your investment strategies.


