
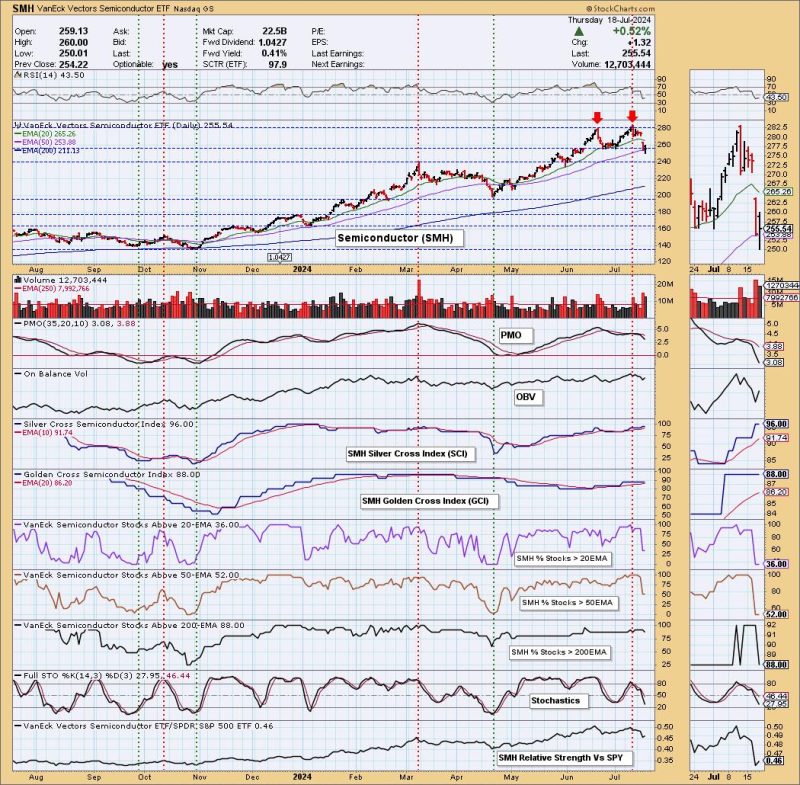
The double top is a frequently observed chart pattern in technical analysis, usually indicating a trend reversal, and it applies as well to the analysis of semiconductors. This pattern signifies that the security is unable to break through a specific resistance level twice and hence signals that a bullish trend may be about to end, with a bearish one on the rise. The VanEck Vectors Semiconductor ETF, known by its ticker symbol SMH, is one of the most prominent vehicles for investors interested in the semiconductor space.
Understanding Double Top Pattern
Two peaks form the double top pattern, often resembling the shape of an ‘M’. To qualify as a double top, these peaks should not be too far apart in distance, with a moderate trough between them. In addition to the two peaks, one mandatory attribute of the double top pattern is the ‘neckline.’ This level of support appears to be flat or slightly tilted, connecting the lowest points on the chart.
When the price falls below the neckline after forming the second peak, traders see it as a selling signal because it confirms the bearish reversal. This bearish reversal implies that market sentiment may be shifting from a bullish to a bearish bias, which may result in a downward price trend.
Application on Semiconductors (SMH)
The VanEck Vectors Semiconductor ETF (SMH) serves investors as a means of sector exposure, primarily to U.S. semiconductors. It’s an excellent barometer of the U.S. semiconductor industry as the ETF reflects the performance of the MVIS US Listed Semiconductor 25 Index, which tracks the largest and most liquid U.S. semiconductor companies.
Let’s assume SMH demonstrates a double top pattern on its price chart – this would indicate a potential bearish reversal for the overall semiconductor sector and hence, should be evaluated carefully by the investors.
In the first instance of reaching the top, known as the ‘first peak’; SMH is obstructed by resistance. This scenario indicates the saturation point where selling pressure surpasses the buying power, thus pushing the prices down towards the support level to form the trough.
After experiencing a temporary dip (the trough), SMH’s price rebounds to retest the previous resistance level, forming the ‘second peak.’ If the selling pressure continues to dominate again, it would lead to a price drop, thus tracing the double top pattern.
When the price falls below the ‘neckline’ or support level, the formation of the double top pattern on SMH’s stock concludes. It is crucial for investors to observe this point as it may be an optimal moment for exit or even a short position.
Double top forms in conjunction with other technical analysis tools should not be overlooked. Remember, it’s not necessarily a sell-off every time a double top appears in a stock or index like SMH. Assessing alongside the price volume, indicators such as the Moving Average Convergence Divergence (MACD), the Relative Strength Index (RSI), or Bollinger Bands might provide a more complete technical outlook.
In conclusion, double top pattern on SMH is a valuable tool in predicting potential trend reversals. However, investors should use caution, as this pattern, like all technical analysis tools, is not infallible and should be used in conjunction with other indicators and investment strategies that suit individual risk tolerance and investment objectives.


