
Bearish Engulfing Pattern Marks Top For NVDA?
To decode whether bearish engulfing patterns can mark the top for NVDA (NVIDIA Corp), we first need to understand what a bearish engulfing pattern is and how it impacts a stock’s performance. A bearish engulfing pattern is a technical chart pattern that signals potential downside reversal in the financial markets. Specifically, in the case of NVDA, it may indicate that the stock may have reached its peak and could be due for a pullback.
The bearish engulfing pattern consists of two candlesticks. The first candlestick is smaller and presents an upward trend, while the second (the bearish candlestick) maintains a closing price lower than the opening price of the first candlestick. Hence, it is a classic engulfing as the whole body of the second (bearish) candlestick covers or engulfs the body of the first (bullish) candlestick, indicating that the bears have overtaken the bulls.
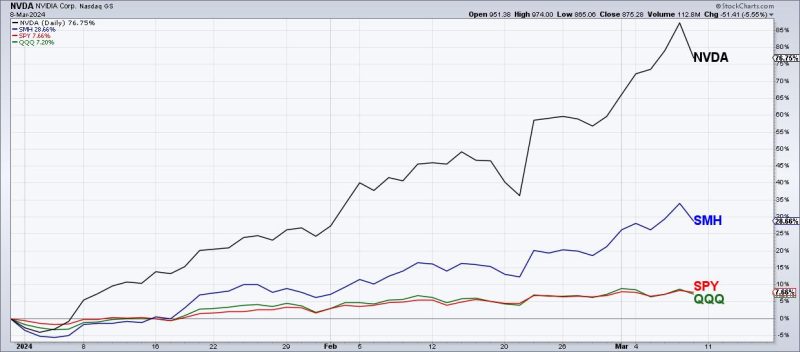
Fast-forward to NVDA, a leading graphics processing unit (GPU) producer dominating the tech industry. The company’s stock has shown impressive performance recently, with prices skyrocketing to new highs backed by its strong fundamentals such as robust demand for its GPUs, growth in data center business, and strategic acquisitions.
However, upon a thorough analysis of NVDA’s recent price charts, a bearish engulfing pattern was observed. Specifically, after a continued upward trajectory, the second candlestick engulfed the prior day’s upward trend candlestick, forming a bearish engulfing pattern. This appearance suggested that selling pressure had overcome buying pressure, possibly indicating an upcoming downward trend or a slow down in the momentum of the upward trend.
Yet, does this mean that NVDA’s high-flying journey is coming to an end? Not necessarily. While the bearish engulfing pattern is indeed a powerful reversal signal, it needs to be evaluated in conjunction with other technical and fundamental indicators. It’s essential to take note that a single pattern does not guarantee a change in trend, but it provides an early warning sign.
For example, the volume at which the bearish engulfing pattern occurs can be critical. If the pattern formed on a day with high trading volumes, the signal is typically seen as stronger. Similarly, if the pattern appears when the stock price is touching a long-term resistance line, it could be a stronger bearish signal.
Moreover, the macroeconomic conditions, company-specific news, and outlook can also affect the stock’s future trajectory. NVDA’s prospects in the artificial intelligence, gaming, and autonomous vehicle spaces, along with its robust revenue growth, could act as strong supports for the stock and could mitigate the potential downside predicted by the bearish engulfing pattern.
In conclusion, while the emergence of a bearish engulfing pattern on NVDA’s stock chart could be interpreted as an early warning sign of a possible reversal, it should not be processed in isolation. Investors are recommended to execute due diligence, consider other technical indicators, evaluate trading volumes, comprehend the broader market sentiment, and factor in NVDA’s solid growth prospects. Therefore, though the pattern might offer a chance to secure profits or limit losses, it is too soon to definitively mark the top for NVDA.


