In the first part of our discussion on Market Research and Analysis, we delved into the basics of defining your target market, understanding consumer behavior, and interpreting market trends. Now, we shall further our discourse by shedding light upon the use of Technical Indicators in analyzing markets, a critical tool for investors and traders alike.
Understanding Technical Indicators
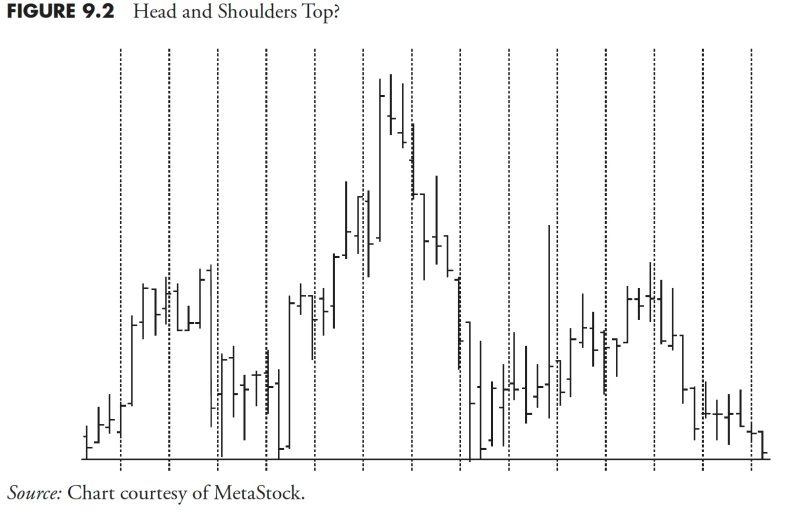
Technical indicators, a key element of technical analysis, refer to mathematical calculations based on security’s price and volume. They are algorithms that utilize historical market data to forecast potential price movements. They are popularly used by traders and analysts to anticipate the future market trends, utilizing historical data to predict potential market movements. The resulting data is presented in a visually intuitive form, such as oscillators, moving averages or patterns on a trading chart, simplifying decision-making when trading.
Types of Technical Indicators
There are several types of technical indicators, each providing information about different aspects of the market. The most commonly used include:
1. Trend Indicators: These tools, for instance, the moving average, are used to detect the direction of market trends and to identify any changes therein.
2. Momentum Indicators: They are designed to identify the speed of price movement or rate of change in prices. Examples include the relative strength index (RSI) and stochastics.
3. Volume Indicators: These indicators gauge the strength of a price movement by measuring the volume of shares traded. Higher volume typically suggests stronger price movements.
4. Volatility Indicators: They measure the rate of price movements over a specific period. They provide insight into the stability of the market. Examples include Bollinger Bands.
Applying Technical Indicators
Before diving into using technical indicators, it’s important to understand that no single indicator offers a complete picture. They are best used in combination with each other and in conjunction with other market analysis techniques.
Choosing the right indicators depends on your trading style, the specific security being traded, and your personal comfort with interpreting data from each type. It’s advisable to start with popular ones like moving averages or the RSI, then branch out as you gain more experience and understanding.
Critics of technical indicators argue that they are reactive, not predictive, as they rely on past market data. However, well-interpreted technical indicators can yield valuable insights and aid decision-making, particularly for short-term trading strategies.
Interpreting Technical Indicators
Interpreting technical indicators requires analytical skills and practice. A commonplace method of interpretation is to search for ‘bullish’ or ‘bearish divergence’. Divergence occurs when the price of an asset and an indicator are heading in opposite directions. Bullish divergence happens when the price is in a downtrend, but the indicator starts to rise – this may indicate an upcoming price rise. Bearish divergence is the reverse – even though the price is rising, the indicator starts to fall, suggesting a potential price drop ahead.
The journey of market research and analysis using technical indicators requires time, patience, and continual learning. However, they not only help predict market actions but also, when used effectively, can lead to profitable trading strategies and more informed investment decisions.
In part three of our market analysis series, we will delve deeper into understanding other practical tools in market research that will bolster your trading strategies and targets. Until then, keep all these factors in mind, and let’s delve into the lucrative world of market analysis using technical indicators.


