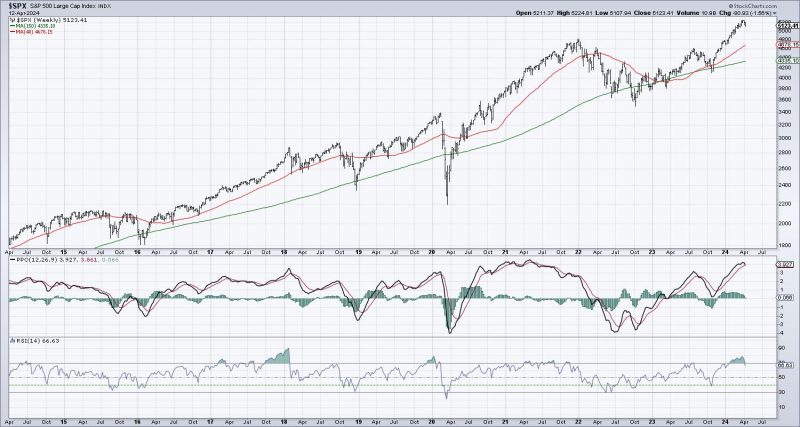
The S&P 500, often regarded as a trustworthy barometer for the overall U.S. equities market, has recently begun showing several fundamental and technical indicators that seem to predict a potential topping pattern. Traders and investors who have been riding the bull market up until now should pay close attention to these signals. This, however, shouldn’t actuate an urgent trigger for portfolio liquidation but ought to encourage a more careful analysis of market dynamics at play.
One of the clear signals pointing towards a shift in the S&P 500’s upwards momentum is the marked increase in volatility. An active market stalwart, the VIX, also dubbed the Fear Gauge, has been swinging sharply, and this instability often flags a potential shift in market sentiment. Historically, increased volatility has often preceded market downturns, as was observed before the Dotcom bubble burst in 2000 and the Great Recession of 2008.
In addition to heightened volatility, the market is also displaying a divergence in terms of advancing and declining issues, known as the breadth of the market. Despite the S&P 500 Index reaching new all-time highs, fewer stocks are participating in this upward trend, another classic sign of a market top. The market typically shows substantial uniformity during its ascent, so this underperformance among a majority of the issues can underline a brewing storm underneath the surface of record-breaking indexes.
An intensification in speculative trading is another signal to observe. Recently, there has been a pronounced upsurge in day trading and speculation fueled by retail investors, often leading to considerable spikes in the standard market order volume. Historically, similar behavior has coincided with market tops as it reveals an overly optimistic market sentiment, which frequently reverses sharply as soon as this euphoria subsides, leading to plummeting stock prices.
Lastly, price-to-earnings (P/E) ratios are nearing all-time highs. The S&P 500’s current P/E ratio is well above its long-term average, indicating that stocks may be overvalued. This metric underscores the market’s optimistic future earnings expectations. However, if these expectations fail to materialize, P/E ratios and stock prices may come falling down back to their historical norms.
In conclusion, while these signs triggered by the S&P 500 potentially indicate a major turning point in the market dynamics, it doesn’t necessarily denote an immediate market crash. These indicators suggest an increased risk in the equities market and a slowdown in upwards momentum. Therefore, investors should approach these signals as the market demanding increased vigilance and measured decision making, not a quick-fire sell-off switch. The importance lies in interpreting these signals in the context of a thorough assessment of the market, ensuring that actions remain informed, balanced and strategic. Embracing active portfolio management and risk tolerance will ensure optimal positioning in the shifting market landscape.


