
Understanding Diverging Tails on Relative Rotation Graphs
Diverging tails on a Relative Rotation Graph (RRG) can take seasoned traders on an exploratory journey filled with potential reward. At the heart of these graphs lie the delicate dynamics of asset rotation within a market, harnessing which can provide discerning traders with lucrative trading opportunities.
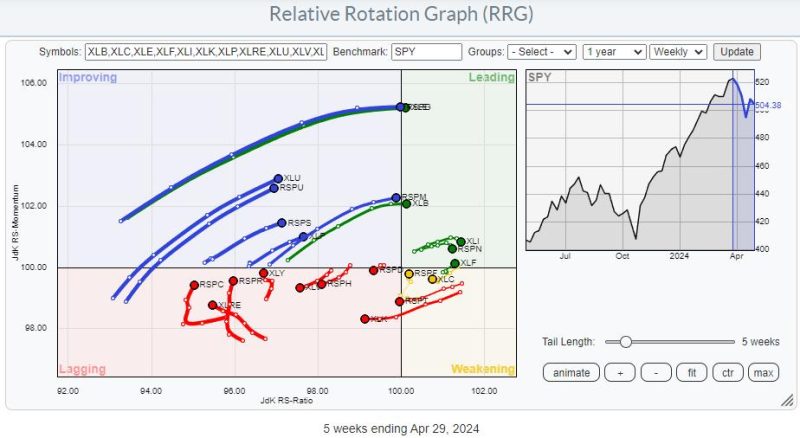
Relative Rotation Graphs
Before delving into the complexities of diverging tails on RRGs, let’s build foundational knowledge about these graphs. Relative Rotation Graphs (RRGs) were pioneered by Julius de Kempenaer, a Dutch financial market analyst. These graphs offer a visual representation of the rotational movement of assets in a Portfolio or an Index. Through quadrant rotation, the RRG showcases the relative strength and relative momentum of individual assets, encapsulating their entire life cycle from leading, weakening, lagging, to improving, and returning to leading again.
Unpacking Diverging Tails
The crux of this discussion is the diverging tails on these relative rotation graphs, which simply refer to the graphical representation of the change in relative strength and momentum of different securities over a specific period. Each tail signifies an asset, and the direction and length of the tail indicate the asset’s relative performance.
The term ‘divergence’ points to a situation where the price of an asset is moving in the opposite direction to a related indicator or another asset. In context, diverging tails provide crucial insights into asset performance variance over time. The divergence is often indicative of evolving market conditions, presenting ripe trading opportunities for traders who can successfully interpret the signals.
Identifying Trading Opportunities
As the tail lengthens, it signifies that the price momentum for the asset is increasing. Conversely, a shrinking tail size indicates a decrease in price momentum. Diverging tails offer an opportunity to compare different assets and timeframes simultaneously. If one asset’s tail moves towards the ‘leading’ quadrant, it demonstrates a bullish market scenario for that specific asset, signalling to traders about a potential buying opportunity. Similarly, if an asset’s tail is heading towards the ‘lagging’ quadrant, that suggests a bearish market situation, indicating a possible selling opportunity.
Effective Use of Diverging Tails for Informed Trading Decisions
For maximum benefit from diverging tails on RRGs, traders need to steer clear of myopic focus on a single security. The strength of these graphs lies in comparative analysis and the understanding of the systematic shift of assets between various lifecycle stages. By observing multiple diverging tails, traders can identify trends, potential reversals, and make informed decisions accordingly. For example, a regular underperforming asset showing a movement towards the leading quadrant can demonstrate an impending market shift. Traders who catch this early can reposition their portfolio for potential profit.
Additionally, traders should keep in mind that diverging tails provide a relative view of the market rather than an absolute one. Even an asset positioned in the weakening quadrant can outperform an asset in the leading section, provided the broader market is going downhill.
In a nutshell, diverging tails on Relative Rotation Graphs offer traders an opportunity to visualize the relative momentum and strength of various assets. By closely monitoring these divergences, traders can harness the potential to tap into rewarding trading opportunities. By aligning their decisions with the nuanced insights offered by these tails, traders set the stage for possible gains in the ever-evolving dynamics of the financial market.


